AdvocatesTV • June 16, 2020
UPLB Math Prof: Actual Covid-19 positives may have reached 35K
University of the Philippines Los Baños mathematics professor Dr. Virgilio P. Sison says the number of positive cases may have reached 35,000.
“There is still a validation backlog of 6,798 cases, as there are actually 32,728 unique individuals who have tested positive for Covid-19, but only 25,930 of them have been confirmed. The backlog has stayed around this number for the past two weeks now,” Sison said.
The professor also said that based on the current positivity rate of 7%, 2,149 out of 30,703 individuals currently reported by DOH as suspect might be positive for the disease.
He also cited the possibility that some patients using ICU (intensive care unit) beds dedicated to Covid-19 cases may not have been included in the count. The DOH said 428 patients are occupying ICU beds, but only 80 are reported as being in severe or critical condition.
Sison also said more individuals are being tested now, with the government’s testing capacity having increased to 0.43% of the national population compared to 0.29% on May 31, while 715,484 tests remain available as of Tuesday.
“The number of positive cases is very important because this gives a picture of the extent of infection in the country. Definitely there is still local community transmission in Metro Manila, and in other critical areas, especially in Cebu City,” he said.
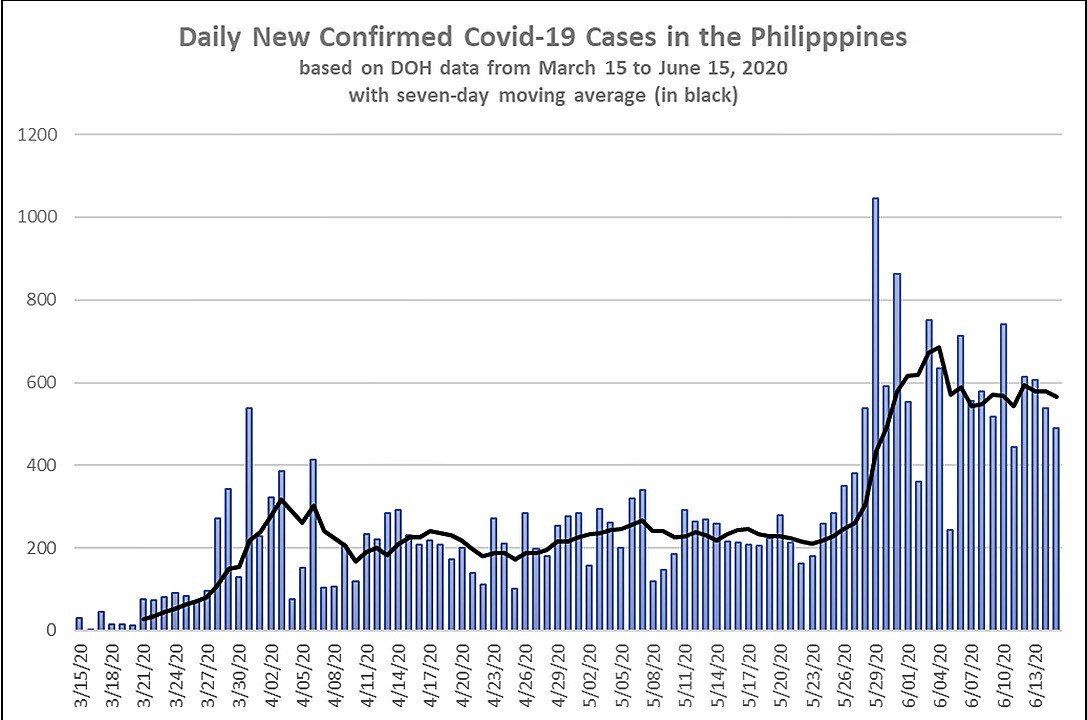
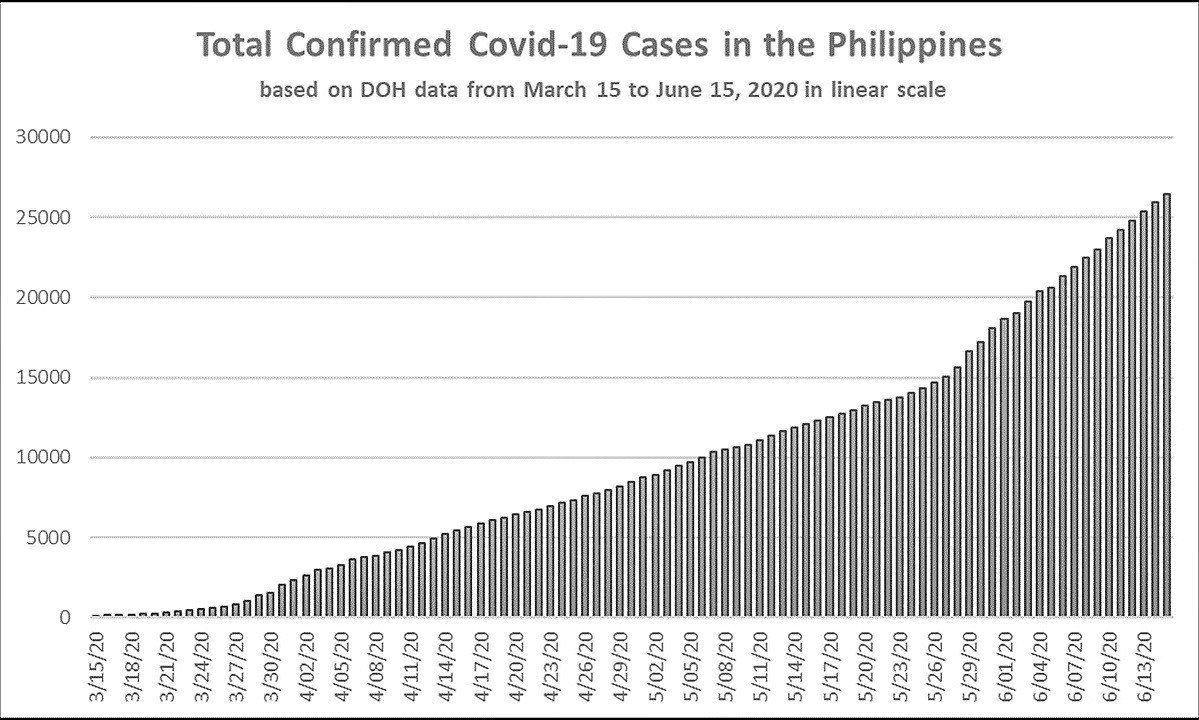
Sison also noted a sharp acceleration in the number of total cases since the last week of May. This coincided with the shifting of many areas of the country from ECQ (enhanced community quarantine) to GCQ (general community quarantine).
The professor also said it will take a longer time and greater effort to push down the curve of positive cases further and finally bring it down to zero.
Sison supported the continuation of protocols for controlling the spread of Covid-19.
“The only way for now to control the infection is to strengthen social distancing measures and other mitigation efforts, like wearing of face masks in the workplace, in transport systems and in other public areas,” he said.
The first graph shows the daily new cases with the seven-day moving average, while the second and third graphs give the total cases in linear scale and in logarithmic scale.